The basis of the MACD divergence strategy is the fact that the MACD is a leading indicator which sometimes points to change in trend of price action, before the price action itself moves in the direction of the MACD indicator.
There are two components of this strategy: the divergence and the convergence. Choose any ongoing Forex competition to test the strategy safely on Demo account.
1) MACD Divergence
The lines of the MACD indicator typically form peaks and troughs, which usually are in tandem with the peaks and troughs of the price action. However, there are occasions when the MACD indicator’s peaks and troughs will deviate from those of the price action, creating a divergence trading opportunity.
The opportunity exists because the price action will eventually correct in the direction of the MACD indicator. The Forex trader therefore aims to spot the point at which this divergence occurs, sets up the trade and then waits for the price action to deliver the trade into profit territory.
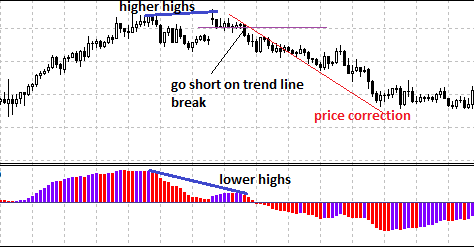
So how can the MACD divergence be spotted? The divergence occurs when the price action forms higher highs when the MACD forms lower highs.
The way to trade this divergence is to short the currency pair on which this has occurred. The divergence short trade must be setup using clear cut technical parameters; it is not a random event.
This is the only way to guarantee good entries that will not lead to drawdowns, or cause the trader to sacrifice pips that could have been banked in profits. These technical parameters are as follows:
- A bearish candlestick formation.
- A resistance pivot point area.
- A trendline break to the downside.
Short Trade
For this trade, we are looking for three things:
- The divergence
- The entry trigger
- Appropriate Stop Loss (SL) and Take Profit (TP) levels

Here is a classical divergence trade on the 1 hour chart of the NZDJPY. The divergence is spotted as shown. Once divergence has occurred, the next thing to look out for is the entry trigger for the trade.
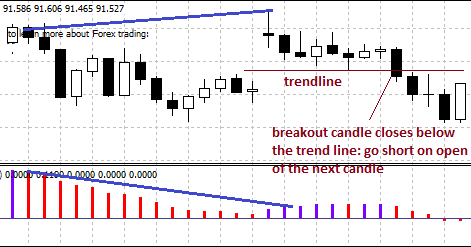
Notice that after the divergence has occurred, several candles formed which were in a sideways trend. A trendline can therefore be drawn across the lows of these candles to show a trendline. The break of this trend line is what will constitute the trigger for the trade as shown below:

Enlarged snapshot of the trend line area
This broken trend line will now form the basis for setting the stop loss, which should be set a few pips above the high of the breakout candle.
Traders are advised to let the trade run. Usually the MACD will give the signal of when the trade will turn. When the bars of the MACD start to head towards positive territory, then it is time to exit the trade.
2) MACD Convergence
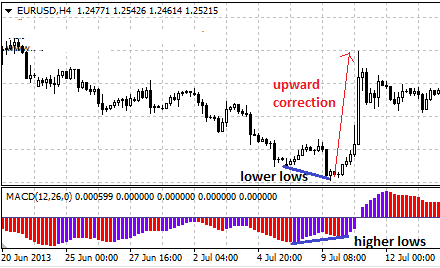
For the MACD convergence trade, we look for a situation where the price action is forming lower lows while the MACD indicator is forming higher lows.
The opportunity exists because the price action will eventually correct in the direction of the MACD indicator. The trader therefore aims to spot the point at which the convergence occurs, sets up the trade and then waits for the price action to deliver the trade into profit territory.
So how can the MACD convergence be spotted? The convergence occurs when the price action forms higher highs when the MACD forms lower highs.
The way to trade this convergence is to go long on the currency pair on which this has using clear cut technical parameters. These technical parameters are as follows:
- A bullish candlestick formation.
- A support pivot point area.
- A trendline break to the upside.
Long Trade
For this trade, we are looking for three things:
- The convergence
- The long trade entry trigger
- Appropriate Stop Loss (SL) and Take Profit (TP) levels
An example of the MACD convergence, which is traded as a long entry, is shown below:

A very clear pattern of convergence is seen here, with the price action making lower lows and the MACD making higher lows.
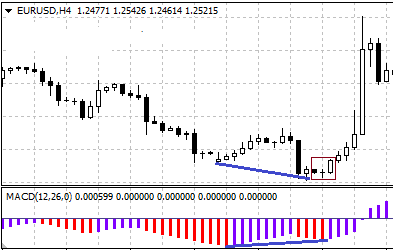
Having detected a convergence trade opportunity, the next stage is to search for the entry trigger. In this case, the entry trigger is a morning star pattern which is shown in this enlarged pattern below:

Enlarged snapshot of the Morning Star candlestick pattern
Another tool that could be deployed in confirmation of this entry is the blue colour of the MACD bars. The colour-coding of this customized MACD indicator is to enable earlier detection of the MACD sentiment.
The Stop Loss for this trade is set below the low of the candlestick pattern, and the Take Profit is set to be flexible. Closing a profitable trade will depend on when the sentiment in the market changes as evidenced by the MACD turning from positive to negative.
