Ichimoku is a technical analysis indicator developed by a Japanese analyst Goichi Hosoda in the 1930s to better predict the direction of trends.
Requirements for the strategy:
• Timeframe: H1, H4, D1;
• Currency pairs: all the pairs available in the terminal;
• The strategy is suitable for medium-term or long-term trading.
In fact, Ichimoku indicator combines four Forex indicators. Tenkan-Sen and Kijun-Sen signal lines can be compared to the 20- and 50-day Moving Averages (MA) with slightly different timeframes:
1. The Tenkan-Sen line is calculated as the sum of the highest high and the lowest low over 7 to 8 previous bars divided by 2. The line is red-colored.
2. The Kijun-Sen line is calculated as the sum of the highest high and the lowest low over the previous 22 bars divided by 2. The line is blue-colored.
Another important element of this Forex indicator is the Ichimoku Cloud, which can be compared to support and resistance lines.
Here are the main components of the "Cloud":
1. The Senkou Span A line is calculated as the sum of Tenkan-Sen and Kijun-Sen divided by 2. It takes into account the previous 26 candles that have closed.
2. The Senkou Span B line is calculated as the sum of the highest high and the lowest low divided by 2. It takes into account the previous 44 candles that have closed, shifted by 22 candles forward.
These lines form the Ichimoku Cloud (Kumo) which determines the volatility of a currency pair. A breakthrough above or below the Cloud can help identify further direction of the price trend.
Chikou Span, the fourth Ichimoku indicator component, reflects market sentiment. Technically, this is the close price plotted 22 periods behind. Chikou Span displays the underlying trend in relation to the current price momentum. When the bulls dominate, Chikou Span is above the current price, and vice versa.
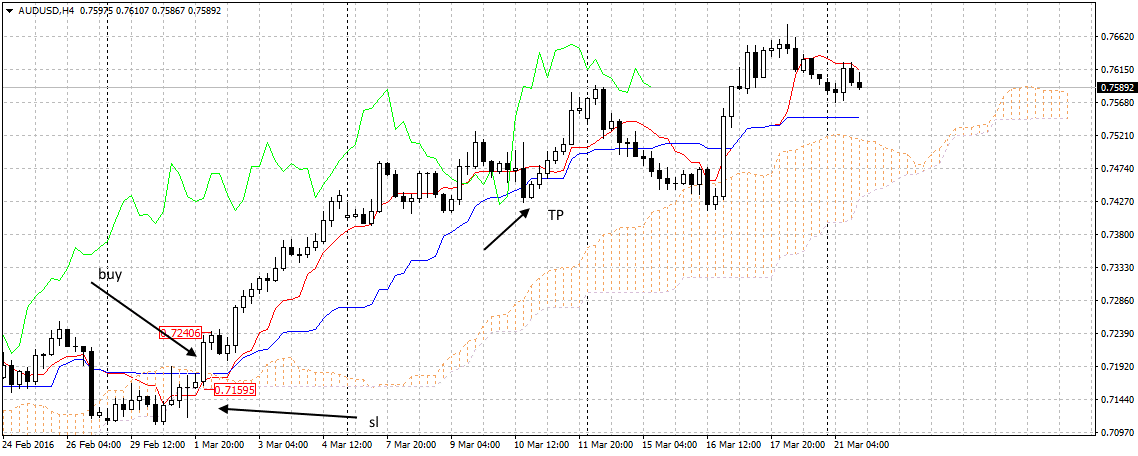
Buy signal:
Look for a candle closing above Tenkan-Sen and Kijun-Sen and buy once the next candle opens. Set a Stop Loss at the previous candle low right away. Place a Take Profit three times bigger than the Stop Loss.
It is also desirable to close the deal or take the profit once you see the signals to sell.

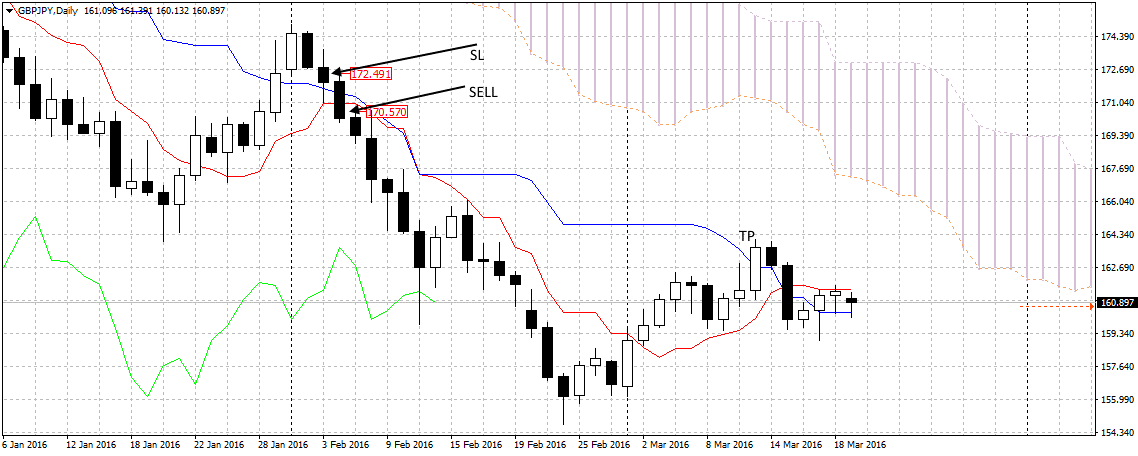
Sell signal:
Look for a candle closing below Tenkan-Sen and Kijun-Sen and sell once the next candle opens.
Set a Stop Loss at the previous candle high right away. Place a Take Profit three times bigger than the Stop Loss.

When the buy signal appears, close the order or take your profit.
Ichimoku Cloud is used as a support or resistance in this trading strategy.
