The essence of the MACD trendline strategy is to use the color-coded MACD histogram indicator as a basis of taking trades when there has been a break of the trendlines in a channel in the direction that is opposite to that of the trend. This is a measure of trend reversal.
So in essence, this is a trend reversal strategy. Ordinarily, trends that are contained within a channel will keep moving in the direction of the trend.
The conventional trade would be to trade off the trendline within the channel, in the direction of the trend. But when the price action breaks out of the trendline in an opposing direction, this is a signal of a trend reversal. We are merely going to use the MACD histogram’s color change to confirm this change.
Indicators
The only indicators we shall use are:
- MACD histogram (color-coded)
- Equidistant channel tool
Charts
We shall use the 4 hour and daily charts, as these are the medium-to-long term charts that are true indicators of trend change. Moves on the 1 hour chart are too transient to consider as true trend changes.
Long Trade
The long trade entry parameters are as follows:
- There must have been a descending channel, formed by the downtrending price action.
- Price action now breaks above the upper trend line of the channel. The breakout of price action is confirmed by a candlestick which closes above the upper trend line.
- The MACD indicator has turned blue. Also watch the direction of the movement of the bars of the MACD histogram. If they have started to turn upwards, this adds further credence to the setup.
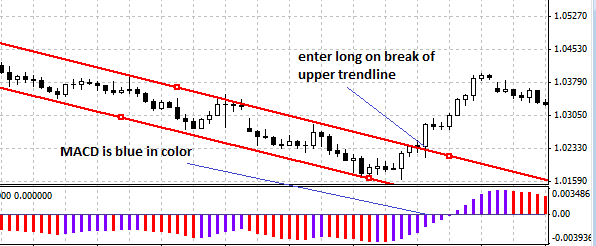
The trade is commenced on the open of the candle that follows the breakout candle. An example of this setup is shown below:

We can see the downtrending channel, and then boom! A price break of the upper trendline occurs. The actual breakout candle is the doji which precedes the long white candle on which the trade is opened.
In setting the stop loss, look at the preceding three candles and set the Stop Loss below the low of the lowest of these three candles. In any case, the stop loss should be set below the broken upper trend line, and the Take Profit set at a distance which is twice or three times the stop loss.
Short Trade
The parameters for a short trade entry are as follows:
- The prevailing trend must be an uptrend, with the formation of an ascending channel.
- Price action now breaks below the lower trend line of the channel. The breakout of price action is confirmed by a candlestick which closes below the lower trend line.
- The MACD indicator has turned red, and if it has also started to turn downwards, this further enhances the signal.
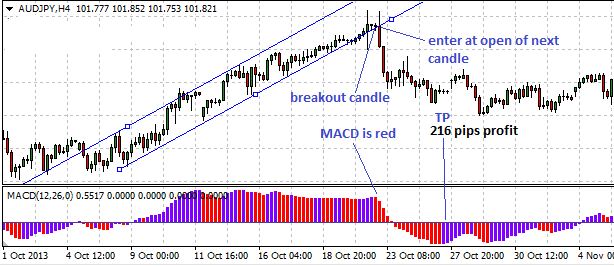
- The short trade is commenced on the open of the candle that follows the breakout candle. An example of this setup is shown below:

This is the 4hour chart on the AUDJPY with an ascending channel. Price now turned and broke the lower trend line, and the MACD histogram also turned red, turning downwards as it did so.
This setup opened the door to have a short trade entry at the designated point as shown in the snapshot.
Once the entry point has been identified, it is time to set the Stop Loss and the Take Profit points.
Borrowing from the long trade setup, we can look at the three candles that precede the entry candle, identify the highest point of those candles, and then set the stop loss above the highest point while setting the TP at an area which is determined by the behavior of the MACD color-coded indicator.
In the snapshot, we decided to use the area where MACD turned blue in color.
Conclusion
It is important to identify the trade entry points. This is defined by the breakout.
For price action to be described as having undergone a breakout, the candlestick must move above a resistance trend line and close above it, or go below a support trend line and close below it.
Once the breakout has occurred, then you can set the trade when the next candle opens.
